John Smith is a seasoned sales manager with over 10 years of experience in the shipping industry. Born and raised in the United States, John developed a passion for the ocean at a young age and knew from an early age that he wanted to work in the maritime industry.
After completing his degree in marine transportation, John began his career as a sales representative for a shipping company, working his way up the ranks to eventually become a sales manager. In this role, John is responsible for managing a team of sales reps and overseeing the sales of the company's ships.
With his extensive knowledge of the shipping industry and his ability to build strong relationships with clients, John has proven to be an invaluable asset to the company. He is known for his ability to negotiate complex deals and close high-value sales, and he has a reputation for consistently meeting and exceeding sales targets.

Explore the Latest Oil Chemical Tanker for sale - Get a Great Deal Today
Ships for Sale Now (10/06/2026)
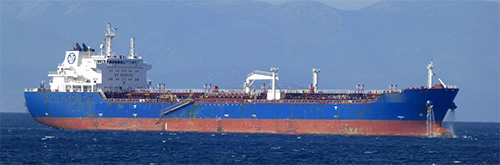
$4,300,000
Looking for a reliable and high-performing tanker for your shipping needs? Look no further than this 2008 Oil/Chemical Tanker! With a carrying capacity of 38375 t DWT and length overall of 182.85 meters, this tanker is built to handle even the most demanding sea journeys. Plus, with Malta-flagged certification, you can be sure of her quality and safety. Don't miss out on the opportunity to add this exceptional tanker to your fleet - contact us today for more information!
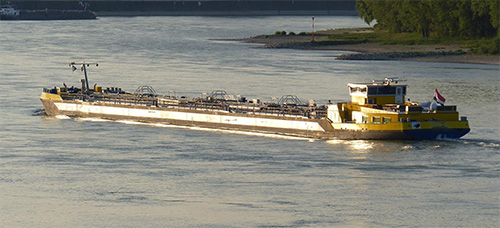
$4,500,000
For sale: Inland Motor Tanker sailing under the flag of Netherlands. This vessel can transport liquid cargo, type C, and measures 110 meters in LOA and 11.4 meters in width. With a spacious deck, this ship is perfect for safe and efficient transportation of your cargo. Don't miss the opportunity to own this versatile and reliable vessel! Contact us today for more information.
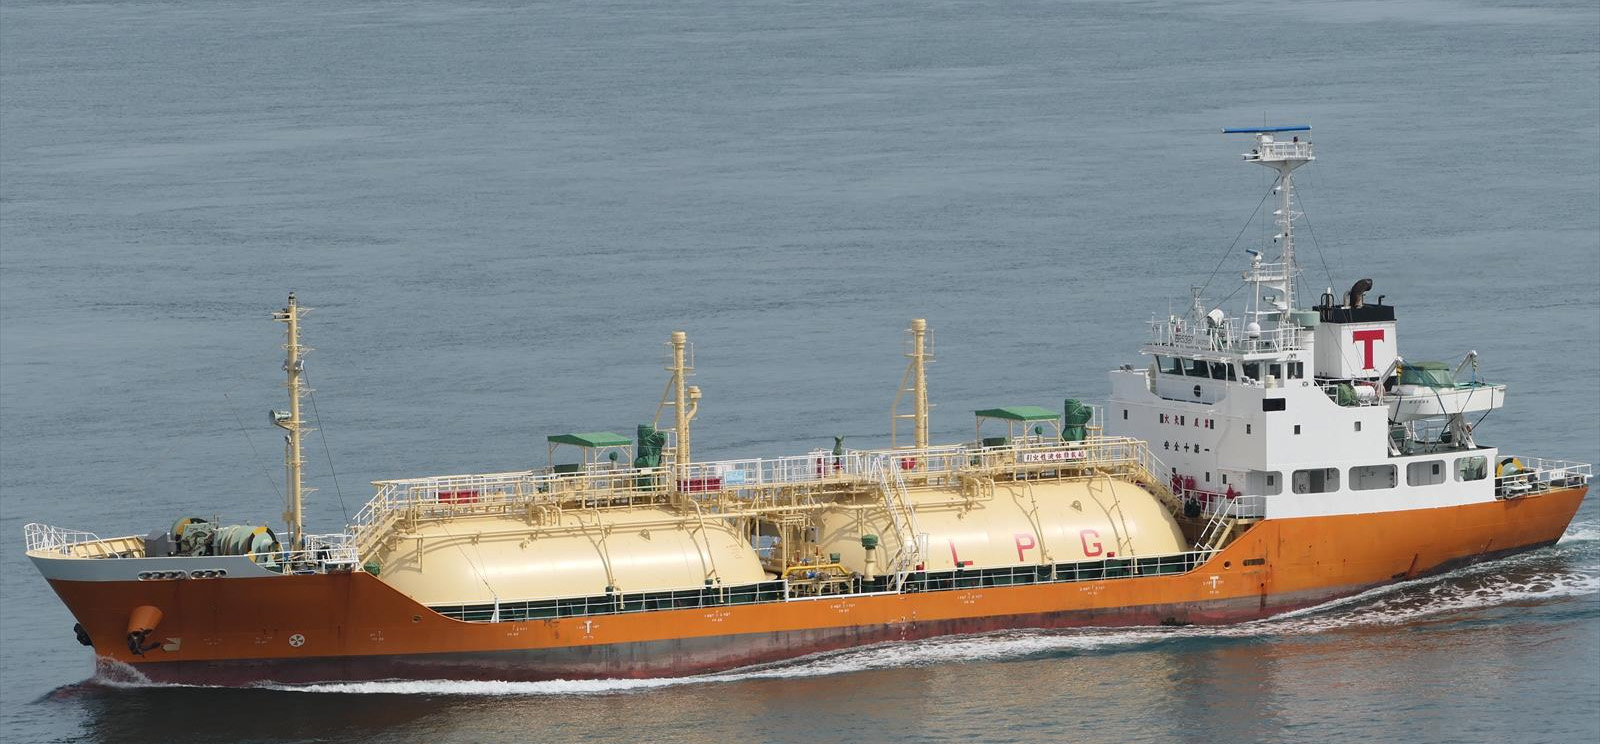
$14,000,000
For Sale: A high-quality LPG tanker built in 2012 and flying the flag of Japan. This well-maintained vessel has a carrying capacity of 1833 cubic meters Liquid Gas and currently has a draught of 4.2 meters. With a length overall (LOA) of 71.15 meters and a width of 12.2 meters, this tanker is perfectly suited for transporting liquid gas in comfort and style. Ideal for business owners looking for a dependable, cost-effective LPG tanker to help them succeed in the industry. Don't let this opportunity pass you by – contact us today to learn more!
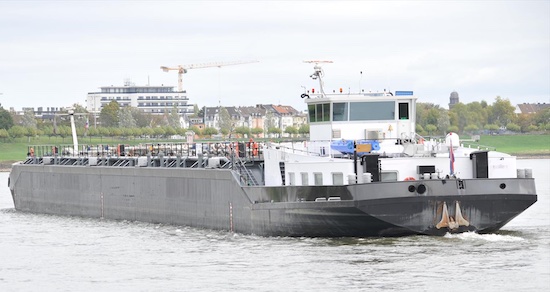
$12,900,000
Looking for a reliable and efficient motor tanker for your liquid cargo transportation needs? Look no further than this Inland motor tanker sailing under the flag of the Netherlands! With a length overall of 110 meters and a width of 11.4 meters, there's plenty of space to safely and securely transport your cargo. This type C tanker is perfect for carrying a wide variety of liquid cargo, making it a versatile addition to any fleet. Don't miss out on this opportunity to own a high-quality vessel at a great price! Contact us today to learn more.
| Ship for Sale | Year | Price, USD |
|---|---|---|
| 🇲🇾 Oil/Chemical Tanker (Malaysia) | 2011 | US $513,677 |
| 🇷🇺 Oil/Chemical Tanker (Russia) | 2011 | US $548,929 |
| 🇮🇹 Oil/Chemical Tanker (Italy) | 1997 | US $778,437 |
| 🇵🇦 Oil/Chemical Tanker (Panama) | 1978 | US $887,003 |
| Oil/Chemical Tanker (Greece) | 1998 | US $933,941 |
| 🇰🇷 Oil/Chemical Tanker (Korea South) | 1978 | US $934,692 |
| 🇸🇬 Oil/Chemical Tanker (Singapore) | 1993 | US $1,144,984 |
| 🇲🇹 Oil/Chemical Tanker (Malta) | 1999 | US $1,301,470 |
| 🇮🇳 Oil/Chemical Tanker (India) | 1970 | US $1,340,065 |
| 🇵🇭 Oil/Chemical Tanker (Philippines) | 2002 | US $1,398,904 |
| 🇱🇷 Oil/Chemical Tanker (Liberya) | 2010 | US $1,416,841 |
| 🇰🇷 Oil/Chemical Tanker (Korea South) | 2001 | US $1,436,531 |
| 🇱🇷 Oil/Chemical Tanker (Liberya) | 2011 | US $1,468,294 |
| 🇱🇷 Oil/Chemical Tanker (Liberya) | 2007 | US $1,501,369 |
| 🇵🇦 Oil/Chemical Tanker (Panama) | 2018 | US $1,530,085 |
| 🇱🇷 Oil/Chemical Tanker (Liberya) | 2005 | US $1,541,761 |
| 🇨🇳 Oil/Chemical Tanker (China) | 2005 | US $1,611,940 |
| 🇮🇹 Oil/Chemical Tanker (Italy) | 2000 | US $1,640,339 |
| 🇱🇷 Oil/Chemical Tanker (Liberya) | 2010 | US $1,647,873 |
| 🇬🇧 Oil/Chemical Tanker (United Kingdom) | 2003 | US $1,653,172 |
| 🇱🇷 Oil/Chemical Tanker (Liberya) | 2008 | US $1,701,240 |
| 🇲🇹 Oil/Chemical Tanker (Malta) | 2004 | US $1,704,570 |
| 🇮🇩 Oil/Chemical Tanker (Indonesia) | 2010 | US $1,706,303 |
| 🇺🇸 Oil/Chemical Tanker (United States) | 2008 | US $1,882,530 |
| 🇮🇩 Oil/Chemical Tanker (Indonesia) | 2014 | US $1,937,050 |
| 🇮🇳 Oil/Chemical Tanker (India) | 2009 | US $1,964,235 |
| 🇳🇱 Oil/Chemical Tanker (Netherlands) | 2009 | US $1,964,584 |
| 🇵🇹 Oil/Chemical Tanker (Portugal) | 2008 | US $1,998,168 |
| Oil/Chemical Tanker (Greece) | 2008 | US $2,001,331 |
| 🇮🇳 Oil/Chemical Tanker (India) | 2016 | US $2,008,630 |
| 🇩🇰 Oil/Chemical Tanker (Denmark) | 2010 | US $2,010,133 |
| 🇬🇧 Oil/Chemical Tanker (United Kingdom) | 2007 | US $2,011,941 |
| 🇲🇹 Oil/Chemical Tanker (Malta) | 2009 | US $2,016,955 |
| 🇮🇩 Oil/Chemical Tanker (Indonesia) | 2001 | US $2,043,514 |
| 🇰🇷 Oil/Chemical Tanker (Korea South) | 2018 | US $2,052,633 |
| 🇮🇹 Oil/Chemical Tanker (Italy) | 2006 | US $2,062,502 |
| 🇻🇳 Oil/Chemical Tanker (Vietnam) | 2009 | US $2,066,539 |
| 🇭🇰 Oil/Chemical Tanker (Hong Kong S.A.R.) | 2016 | US $2,071,600 |
| 🇵🇦 Oil/Chemical Tanker (Panama) | 2017 | US $2,073,870 |
| 🇱🇷 Oil/Chemical Tanker (Liberya) | 2007 | US $2,160,208 |
| 🇮🇳 Oil/Chemical Tanker (India) | 2008 | US $2,168,285 |
| 🇨🇾 Oil/Chemical Tanker (Cyprus) | 2008 | US $2,196,647 |
| 🇺🇸 Oil/Chemical Tanker (United States) | 2006 | US $2,297,414 |
| 🇮🇹 Oil/Chemical Tanker (Italy) | 2011 | US $2,314,014 |
| 🇧🇸 Oil/Chemical Tanker (Bahamas) | 2008 | US $2,320,539 |
| Oil/Chemical Tanker (Norway) | 2002 | US $2,360,214 |
| 🇵🇹 Oil/Chemical Tanker (Portugal) | 2003 | US $2,383,216 |
| 🇮🇹 Oil/Chemical Tanker (Italy) | 2006 | US $2,396,228 |
| 🇱🇷 Oil/Chemical Tanker (Liberya) | 1997 | US $2,424,638 |
| 🇲🇭 Oil/Chemical Tanker (Marshall Islands) | 2007 | US $2,493,054 |
| 🇨🇾 Oil/Chemical Tanker (Cyprus) | 1991 | US $2,524,886 |
| 🇨🇾 Oil/Chemical Tanker (Cyprus) | 2014 | US $2,569,220 |
| 🇧🇸 Oil/Chemical Tanker (Bahamas) | 1996 | US $2,588,929 |
| 🇮🇳 Oil/Chemical Tanker (India) | 2008 | US $2,602,554 |
| 🇮🇹 Oil/Chemical Tanker (Italy) | 2010 | US $2,622,395 |
| 🇨🇳 Oil/Chemical Tanker (China) | 2002 | US $2,637,886 |
| 🇳🇱 Oil/Chemical Tanker (Netherlands) | 2013 | US $2,778,940 |
| 🇮🇩 Oil/Chemical Tanker (Indonesia) | 2010 | US $2,780,278 |
| 🇺🇸 Oil/Chemical Tanker (United States) | 2016 | US $2,797,206 |
| 🇳🇱 Oil/Chemical Tanker (Netherlands) | 2019 | US $2,835,478 |
| 🇬🇧 Oil/Chemical Tanker (United Kingdom) | 2019 | US $2,839,719 |
| 🇧🇸 Oil/Chemical Tanker (Bahamas) | 2011 | US $2,844,213 |
| 🇵🇦 Oil/Chemical Tanker (Panama) | 2006 | US $2,880,149 |
| 🇲🇹 Oil/Chemical Tanker (Malta) | 2008 | US $2,902,907 |
| 🇯🇵 Oil/Chemical Tanker (Japan) | 2003 | US $2,925,720 |
| Oil/Chemical Tanker (Norway) | 2004 | US $2,941,596 |
| 🇩🇰 Oil/Chemical Tanker (Denmark) | 2010 | US $3,000,266 |
| 🇵🇭 Oil/Chemical Tanker (Philippines) | 2020 | US $3,171,385 |
| 🇺🇸 Oil/Chemical Tanker (United States) | 2008 | US $3,225,970 |
| 🇯🇵 Oil/Chemical Tanker (Japan) | 2008 | US $3,228,744 |
| 🇰🇷 Oil/Chemical Tanker (Korea South) | 2010 | US $3,243,658 |
| 🇦🇬 Oil/Chemical Tanker (Antigua And Barbuda) | 2011 | US $3,358,161 |
| 🇨🇾 Oil/Chemical Tanker (Cyprus) | 2013 | US $3,405,374 |
| 🇲🇾 Oil/Chemical Tanker (Malaysia) | 2018 | US $3,503,813 |
| 🇵🇹 Oil/Chemical Tanker (Portugal) | 2006 | US $3,570,184 |
| 🇲🇾 Oil/Chemical Tanker (Malaysia) | 2017 | US $3,618,310 |
| 🇲🇹 Oil/Chemical Tanker (Malta) | 2010 | US $3,740,899 |
| 🇮🇹 Oil/Chemical Tanker (Italy) | 2007 | US $3,764,947 |
| Oil/Chemical Tanker (Norway) | 2010 | US $3,783,609 |
| 🇧🇸 Oil/Chemical Tanker (Bahamas) | 2018 | US $3,862,428 |
| 🇧🇸 Oil/Chemical Tanker (Bahamas) | 2010 | US $3,875,826 |
| 🇵🇦 Oil/Chemical Tanker (Panama) | 2008 | US $3,905,381 |
| 🇻🇳 Oil/Chemical Tanker (Vietnam) | 2014 | US $3,945,155 |
| 🇻🇳 Oil/Chemical Tanker (Vietnam) | 2018 | US $4,059,014 |
| 🇵🇦 Oil/Chemical Tanker (Panama) | 2003 | US $4,136,943 |
| Oil/Chemical Tanker (Turkey) | 2011 | US $4,147,700 |
| Oil/Chemical Tanker (Norway) | 1999 | US $4,234,309 |
| 🇭🇰 Oil/Chemical Tanker (Hong Kong S.A.R.) | 2017 | US $4,255,896 |
| 🇲🇹 Oil/Chemical Tanker (Malta) | 1999 | US $4,272,803 |
| 🇳🇱 Oil/Chemical Tanker (Netherlands) | 2012 | US $4,300,506 |
| 🇮🇳 Oil/Chemical Tanker (India) | 2010 | US $4,426,448 |
| 🇰🇷 Oil/Chemical Tanker (Korea South) | 1999 | US $4,503,765 |
| 🇮🇳 Oil/Chemical Tanker (India) | 2012 | US $4,586,967 |
| 🇧🇸 Oil/Chemical Tanker (Bahamas) | 2009 | US $4,600,338 |
| 🇵🇹 Oil/Chemical Tanker (Portugal) | 2006 | US $4,665,883 |
| 🇨🇳 Oil/Chemical Tanker (China) | 2010 | US $4,678,540 |
| 🇲🇾 Oil/Chemical Tanker (Malaysia) | 2016 | US $4,733,000 |
| 🇺🇸 Oil/Chemical Tanker (United States) | 2011 | US $4,783,598 |
| 🇭🇰 Oil/Chemical Tanker (Hong Kong S.A.R.) | 2008 | US $4,818,347 |
| 🇦🇬 Oil/Chemical Tanker (Antigua And Barbuda) | 2006 | US $4,827,090 |
| 🇯🇵 Oil/Chemical Tanker (Japan) | 2011 | US $4,830,041 |
| 🇱🇷 Oil/Chemical Tanker (Liberya) | 1998 | US $4,872,898 |
| Oil/Chemical Tanker (Norway) | 2014 | US $4,898,358 |
| 🇦🇬 Oil/Chemical Tanker (Antigua And Barbuda) | 2008 | US $4,972,119 |
| 🇱🇷 Oil/Chemical Tanker (Liberya) | 2002 | US $5,014,322 |
| Oil/Chemical Tanker (Greece) | 2008 | US $5,040,095 |
| 🇮🇹 Oil/Chemical Tanker (Italy) | 2016 | US $5,090,864 |
| 🇻🇳 Oil/Chemical Tanker (Vietnam) | 2009 | US $5,125,449 |
| Oil/Chemical Tanker (Turkey) | 2007 | US $5,256,908 |
| 🇬🇧 Oil/Chemical Tanker (United Kingdom) | 2006 | US $5,306,298 |
| 🇲🇾 Oil/Chemical Tanker (Malaysia) | 2008 | US $5,348,712 |
| 🇮🇩 Oil/Chemical Tanker (Indonesia) | 2010 | US $5,349,571 |
| 🇲🇾 Oil/Chemical Tanker (Malaysia) | 2007 | US $5,371,188 |
| 🇱🇷 Oil/Chemical Tanker (Liberya) | 2015 | US $5,433,346 |
| 🇳🇱 Oil/Chemical Tanker (Netherlands) | 2006 | US $5,523,937 |
| 🇺🇸 Oil/Chemical Tanker (United States) | 1998 | US $5,602,340 |
| 🇭🇰 Oil/Chemical Tanker (Hong Kong S.A.R.) | 2000 | US $5,741,425 |
| 🇵🇹 Oil/Chemical Tanker (Portugal) | 2007 | US $5,771,170 |
| 🇲🇭 Oil/Chemical Tanker (Marshall Islands) | 2008 | US $5,844,984 |
| 🇻🇳 Oil/Chemical Tanker (Vietnam) | 2011 | US $5,921,320 |
| 🇩🇰 Oil/Chemical Tanker (Denmark) | 2001 | US $5,937,480 |
| 🇦🇬 Oil/Chemical Tanker (Antigua And Barbuda) | 2017 | US $5,991,399 |
| 🇱🇷 Oil/Chemical Tanker (Liberya) | 2010 | US $6,231,708 |
| 🇲🇭 Oil/Chemical Tanker (Marshall Islands) | 2012 | US $6,259,202 |
| 🇵🇭 Oil/Chemical Tanker (Philippines) | 2015 | US $6,489,343 |
| 🇮🇳 Oil/Chemical Tanker (India) | 2016 | US $6,508,485 |
| 🇺🇸 Oil/Chemical Tanker (United States) | 2012 | US $6,566,099 |
| 🇦🇬 Oil/Chemical Tanker (Antigua And Barbuda) | 2019 | US $6,633,760 |
| 🇭🇰 Oil/Chemical Tanker (Hong Kong S.A.R.) | 2011 | US $6,653,104 |
| 🇳🇱 Oil/Chemical Tanker (Netherlands) | 2000 | US $6,682,084 |
| 🇮🇳 Oil/Chemical Tanker (India) | 2007 | US $7,051,663 |
| Oil/Chemical Tanker (Greece) | 2006 | US $7,138,915 |
| Oil/Chemical Tanker (Turkey) | 2011 | US $7,172,119 |
| 🇬🇧 Oil/Chemical Tanker (United Kingdom) | 2008 | US $7,267,164 |
| 🇲🇭 Oil/Chemical Tanker (Marshall Islands) | 2008 | US $7,287,680 |
| 🇭🇰 Oil/Chemical Tanker (Hong Kong S.A.R.) | 2008 | US $7,362,747 |
| 🇦🇬 Oil/Chemical Tanker (Antigua And Barbuda) | 2007 | US $7,381,183 |
| 🇩🇰 Oil/Chemical Tanker (Denmark) | 2000 | US $7,647,274 |
| 🇭🇰 Oil/Chemical Tanker (Hong Kong S.A.R.) | 1994 | US $7,672,490 |
| Oil/Chemical Tanker (Norway) | 2018 | US $8,136,449 |
| 🇮🇹 Oil/Chemical Tanker (Italy) | 2006 | US $8,149,532 |
| 🇮🇳 Oil/Chemical Tanker (India) | 1986 | US $8,255,885 |
| 🇻🇳 Oil/Chemical Tanker (Vietnam) | 2007 | US $8,387,280 |
| Oil/Chemical Tanker (Turkey) | 2018 | US $8,451,707 |
| 🇵🇭 Oil/Chemical Tanker (Philippines) | 2016 | US $8,527,275 |
| 🇵🇦 Oil/Chemical Tanker (Panama) | 2000 | US $8,686,709 |
| 🇦🇬 Oil/Chemical Tanker (Antigua And Barbuda) | 2017 | US $8,736,667 |
| Oil/Chemical Tanker (Greece) | 2007 | US $8,824,411 |
| 🇧🇸 Oil/Chemical Tanker (Bahamas) | 2010 | US $9,024,589 |
| 🇰🇷 Oil/Chemical Tanker (Korea South) | 2011 | US $9,079,485 |
| 🇲🇭 Oil/Chemical Tanker (Marshall Islands) | 2016 | US $9,326,707 |
| 🇻🇳 Oil/Chemical Tanker (Vietnam) | 2012 | US $9,410,139 |
| 🇸🇬 Oil/Chemical Tanker (Singapore) | 1984 | US $10,334,357 |
| 🇻🇳 Oil/Chemical Tanker (Vietnam) | 2012 | US $10,779,720 |
| 🇵🇦 Oil/Chemical Tanker (Panama) | 1984 | US $10,942,261 |
| 🇷🇺 Oil/Chemical Tanker (Russia) | 2015 | US $11,067,870 |
| 🇮🇩 Oil/Chemical Tanker (Indonesia) | 2016 | US $11,126,095 |
| 🇸🇬 Oil/Chemical Tanker (Singapore) | 1997 | US $11,138,808 |
| 🇬🇧 Oil/Chemical Tanker (United Kingdom) | 2011 | US $11,189,212 |
| 🇭🇰 Oil/Chemical Tanker (Hong Kong S.A.R.) | 2001 | US $11,297,316 |
| 🇮🇳 Oil/Chemical Tanker (India) | 2004 | US $11,433,039 |
| 🇩🇰 Oil/Chemical Tanker (Denmark) | 2009 | US $11,595,895 |
| 🇨🇾 Oil/Chemical Tanker (Cyprus) | 2016 | US $12,079,009 |
| Oil/Chemical Tanker (Norway) | 2014 | US $12,211,587 |
| Oil/Chemical Tanker (Turkey) | 2000 | US $12,614,169 |
| 🇸🇬 Oil/Chemical Tanker (Singapore) | 2011 | US $12,926,144 |
| 🇵🇦 Oil/Chemical Tanker (Panama) | 2008 | US $13,413,781 |
| Oil/Chemical Tanker (Norway) | 2008 | US $13,947,518 |
| 🇦🇬 Oil/Chemical Tanker (Antigua And Barbuda) | 2011 | US $14,161,950 |
| Oil/Chemical Tanker (Greece) | 2008 | US $14,242,715 |
| 🇧🇸 Oil/Chemical Tanker (Bahamas) | 2020 | US $14,445,285 |
| 🇷🇺 Oil/Chemical Tanker (Russia) | 2010 | US $14,624,896 |
| 🇲🇭 Oil/Chemical Tanker (Marshall Islands) | 2000 | US $15,087,935 |
| 🇺🇸 Oil/Chemical Tanker (United States) | 2008 | US $15,308,587 |
| 🇵🇦 Oil/Chemical Tanker (Panama) | 2012 | US $15,666,728 |
| 🇵🇹 Oil/Chemical Tanker (Portugal) | 2008 | US $16,041,222 |
| 🇲🇾 Oil/Chemical Tanker (Malaysia) | 2020 | US $16,957,509 |
| 🇰🇷 Oil/Chemical Tanker (Korea South) | 2018 | US $17,159,875 |
| 🇨🇳 Oil/Chemical Tanker (China) | 2003 | US $17,222,481 |
| 🇸🇬 Oil/Chemical Tanker (Singapore) | 2019 | US $18,375,110 |
| 🇨🇳 Oil/Chemical Tanker (China) | 2003 | US $19,315,263 |
| 🇯🇵 Oil/Chemical Tanker (Japan) | 2008 | US $19,711,936 |
| 🇨🇳 Oil/Chemical Tanker (China) | 2011 | US $20,054,042 |
| Oil/Chemical Tanker (Greece) | 2007 | US $20,696,265 |
| 🇬🇧 Oil/Chemical Tanker (United Kingdom) | 2015 | US $20,750,201 |
| 🇳🇱 Oil/Chemical Tanker (Netherlands) | 2006 | US $20,940,991 |
| 🇵🇭 Oil/Chemical Tanker (Philippines) | 2016 | US $21,816,589 |
| 🇸🇬 Oil/Chemical Tanker (Singapore) | 2009 | US $23,619,010 |
| Oil/Chemical Tanker (Greece) | 2018 | US $23,641,540 |
| 🇵🇦 Oil/Chemical Tanker (Panama) | 2019 | US $23,830,561 |
| 🇵🇦 Oil/Chemical Tanker (Panama) | 2015 | US $24,494,717 |
| 🇮🇳 Oil/Chemical Tanker (India) | 2011 | US $24,708,435 |
| 🇲🇹 Oil/Chemical Tanker (Malta) | 2018 | US $26,912,055 |
| Oil/Chemical Tanker (Greece) | 2018 | US $30,551,763 |
| 🇲🇭 Oil/Chemical Tanker (Marshall Islands) | 2011 | US $38,178,409 |
| 🇲🇭 Oil/Chemical Tanker (Marshall Islands) | 2020 | US $47,602,289 |

All Rights Reserved ©